
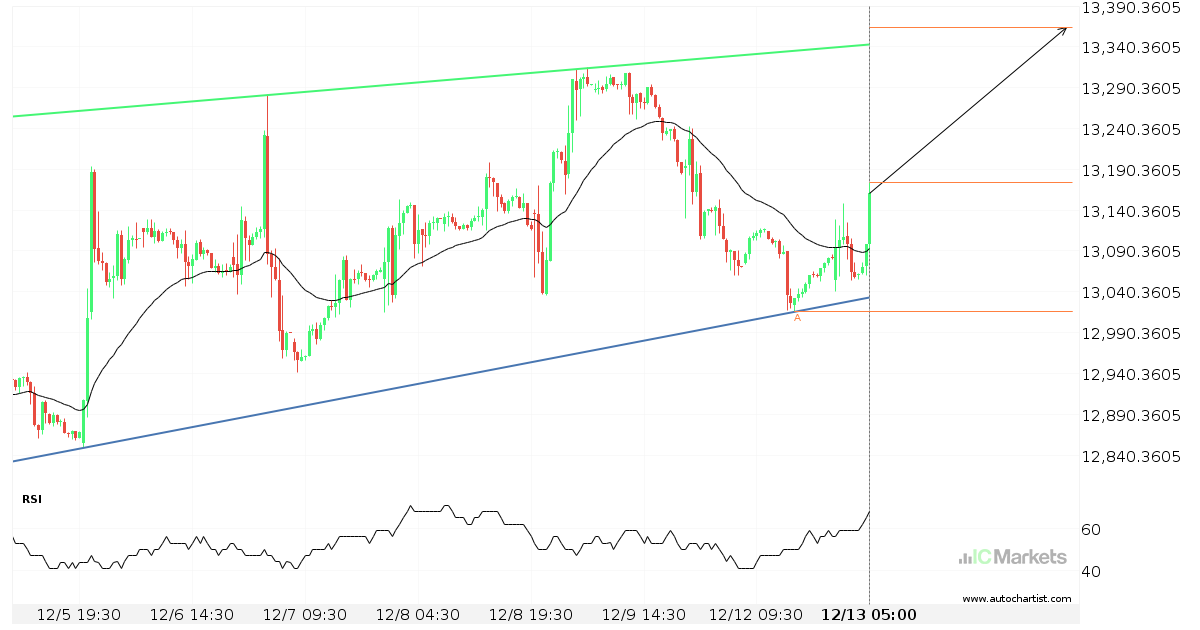
Hong Kong 50 Index approaching resistance of a Channel Up
Hong Kong 50 Index is approaching the resistance line of a Channel Up. It has touched this line numerous times in the last 9 days. If it tests this line again, it should do so in the next 2 days.
FTSE China A50 Index approaching resistance of a Rising Wedge
FTSE China A50 Index is approaching the resistance line of a Rising Wedge. It has touched this line numerous times in the last 8 days. If it tests this line again, it should do so in the next 2 days.
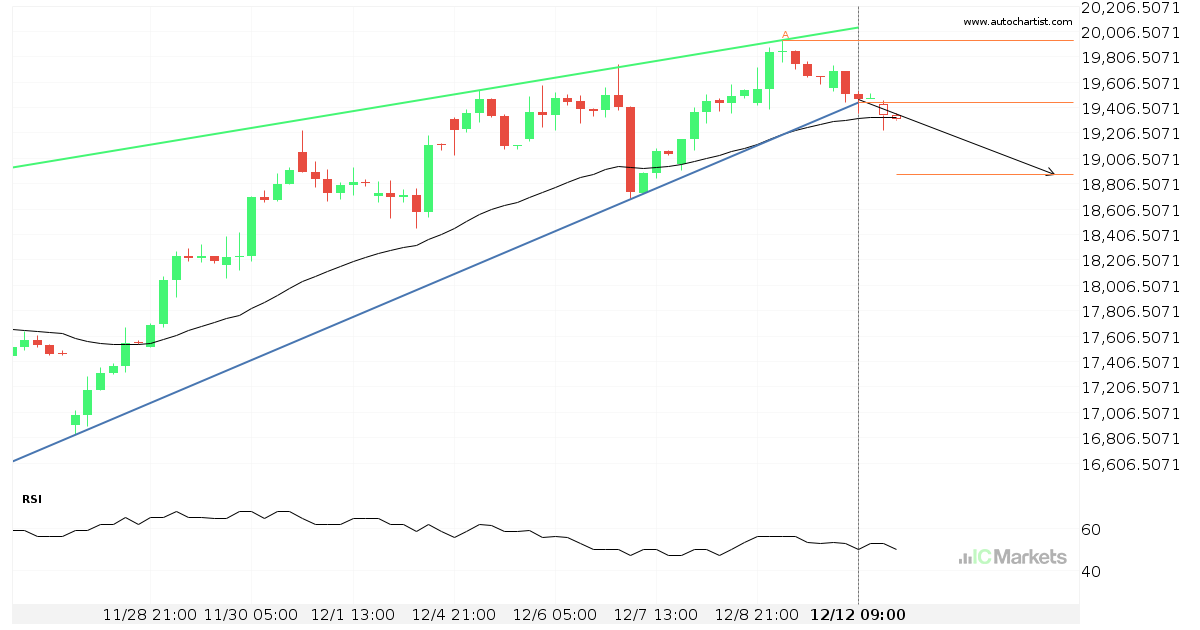
Possibility of big movement expected on Hong Kong 50 Index
Hong Kong 50 Index has broken through a support line of a Rising Wedge and suggests a possible movement to 18876.7504 within the next 3 days. It has tested this line in the past, so one should probably wait for a confirmation of this breakout before taking action. If the breakout doesn’t confirm, we could […]
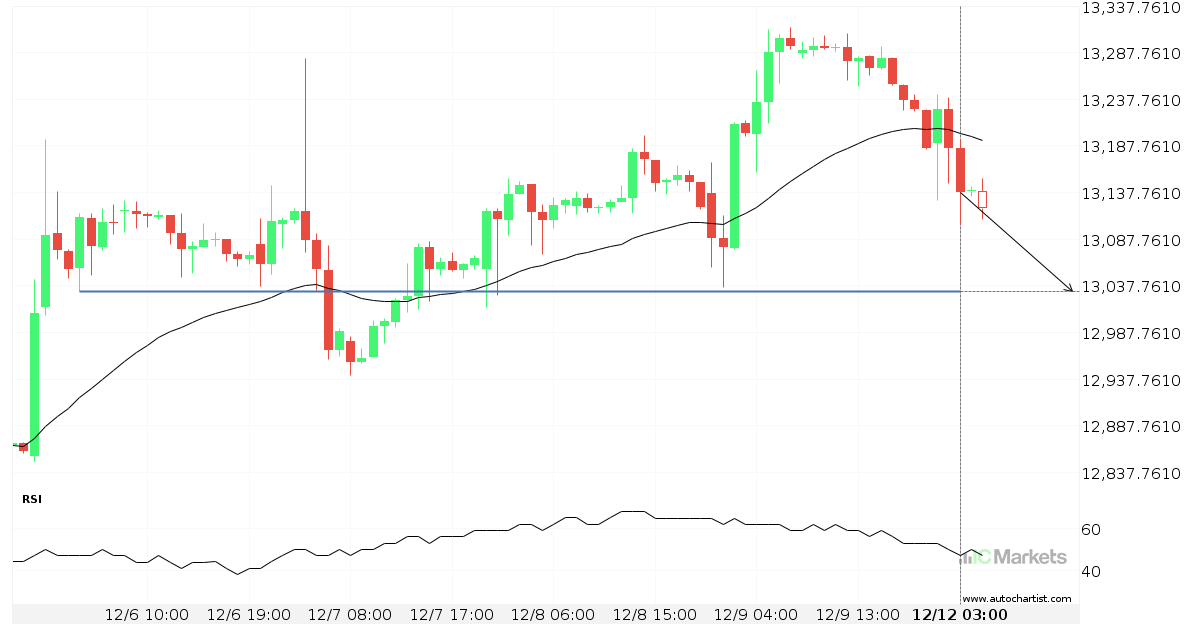
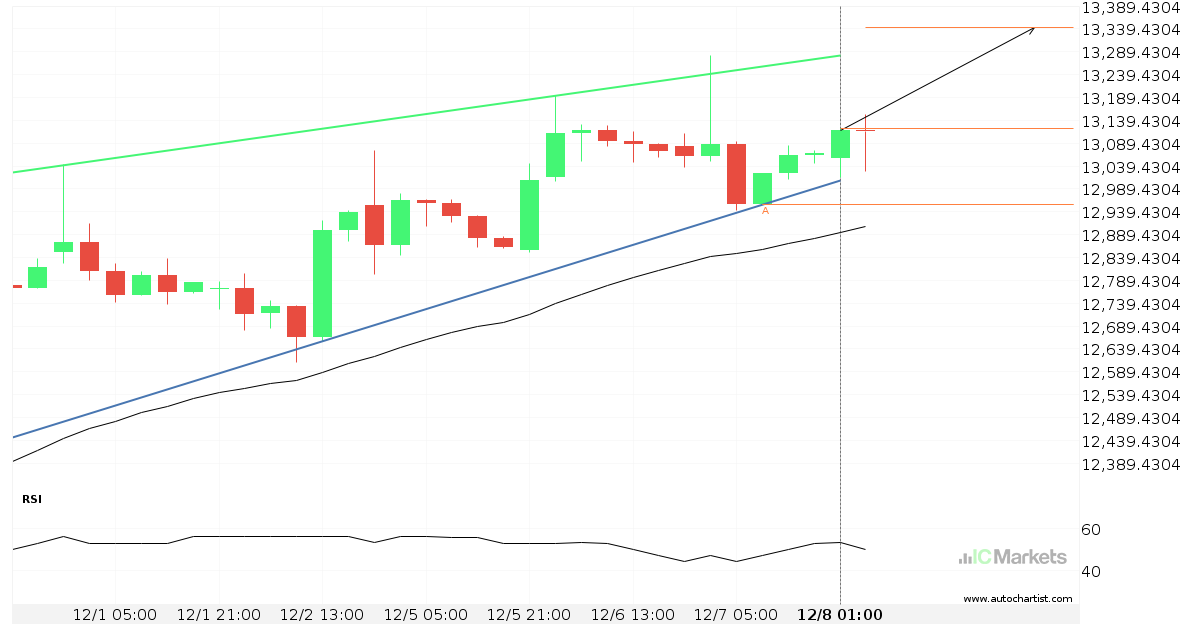
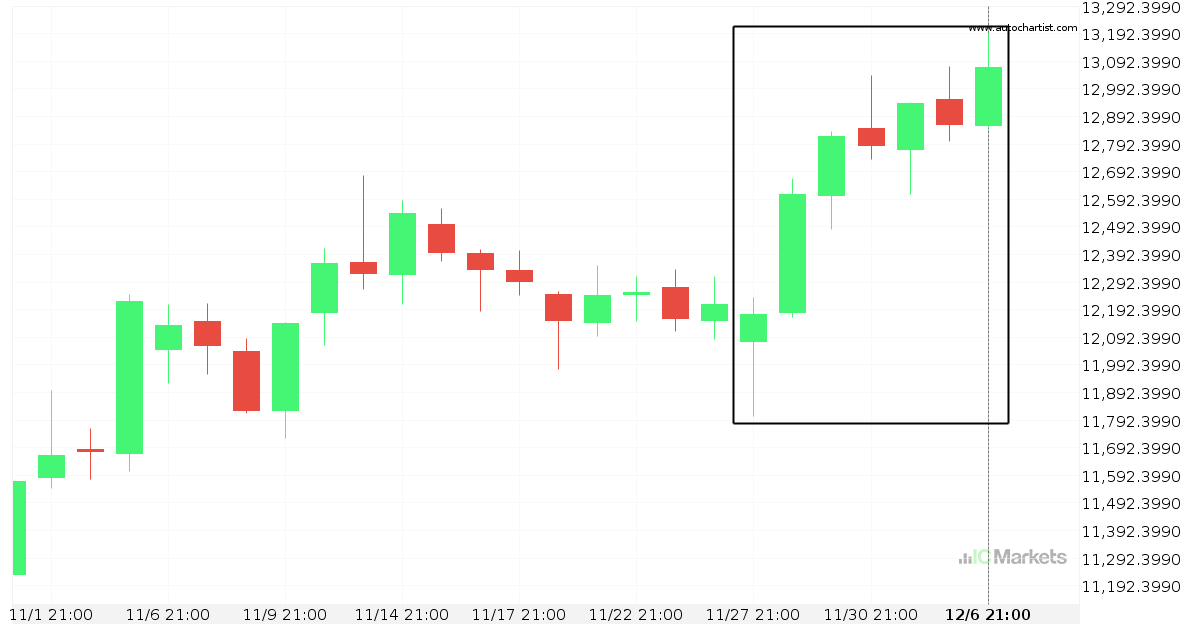
Breach of important price line imminent by FTSE China A50 Index
FTSE China A50 Index is moving towards a line of 13031.5898 which it has tested numerous times in the past. We have seen it retrace from this position in the past, so at this stage it isn’t clear whether it will breach this price or rebound as it did before. If FTSE China A50 Index […]
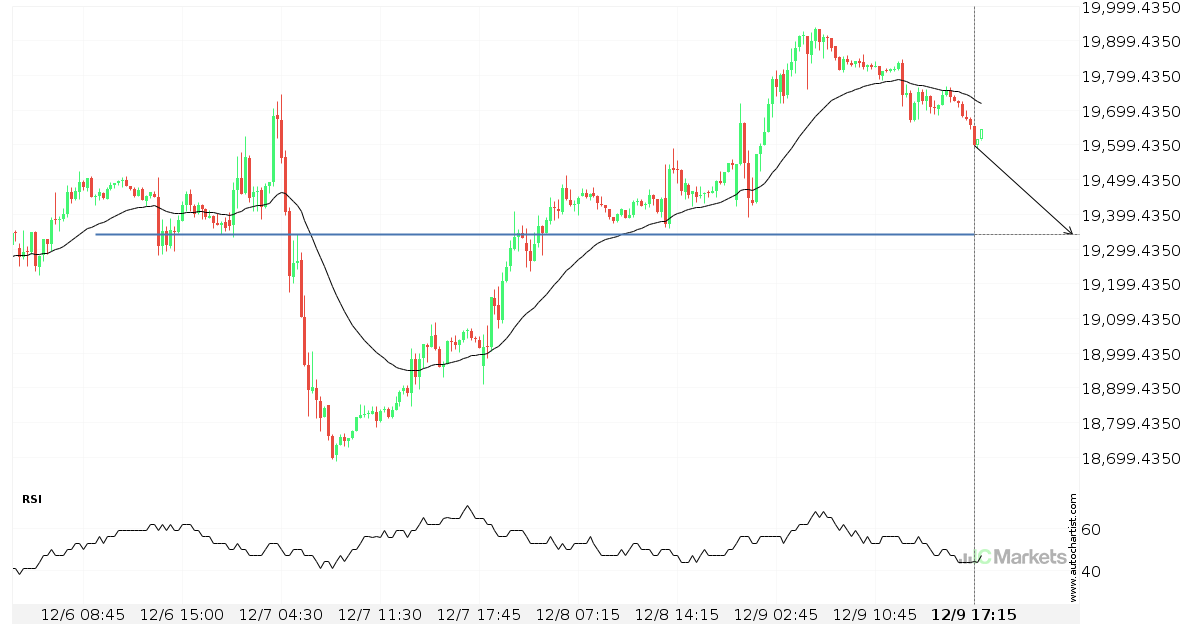
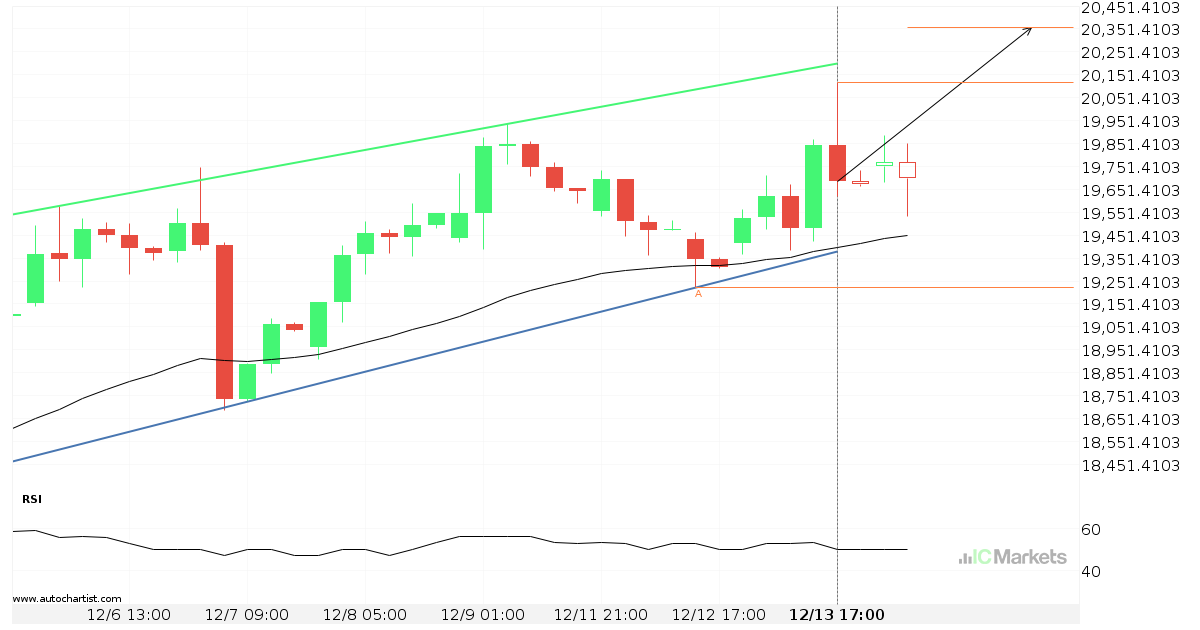
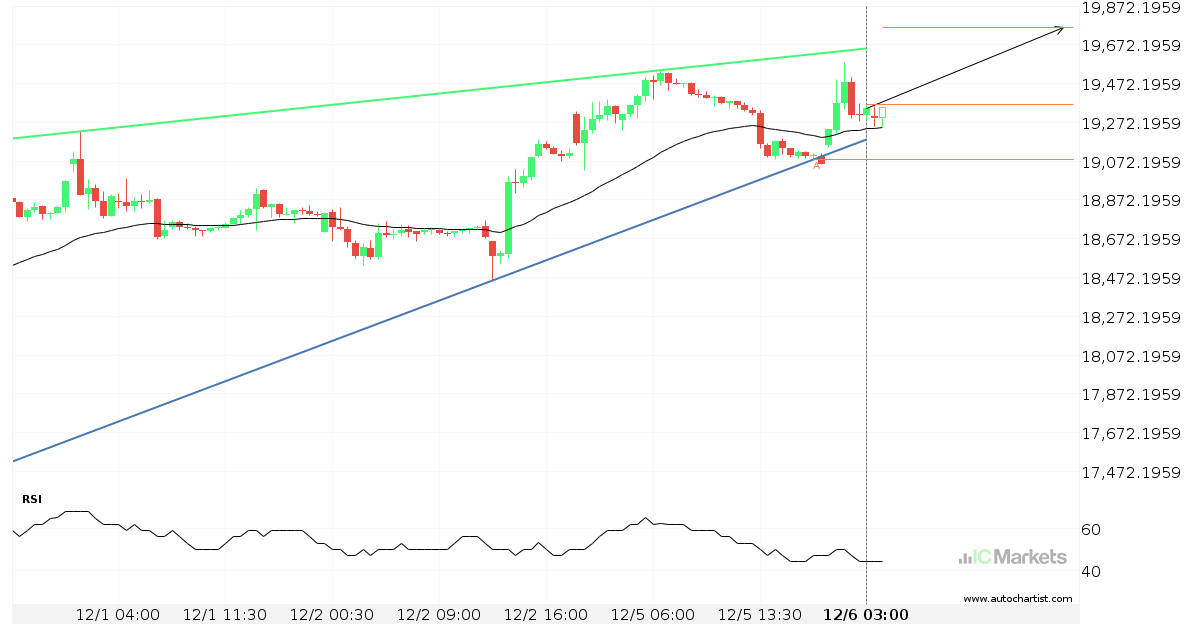
Either a rebound or a breakout imminent on Hong Kong 50 Index
Hong Kong 50 Index is heading towards a line of 19340.1992. If this movement continues, the price of Hong Kong 50 Index could test 19340.1992 within the next 13 hours. But don’t be so quick to trade, it has tested this line numerous times in the past, so this movement could be short-lived and end […]
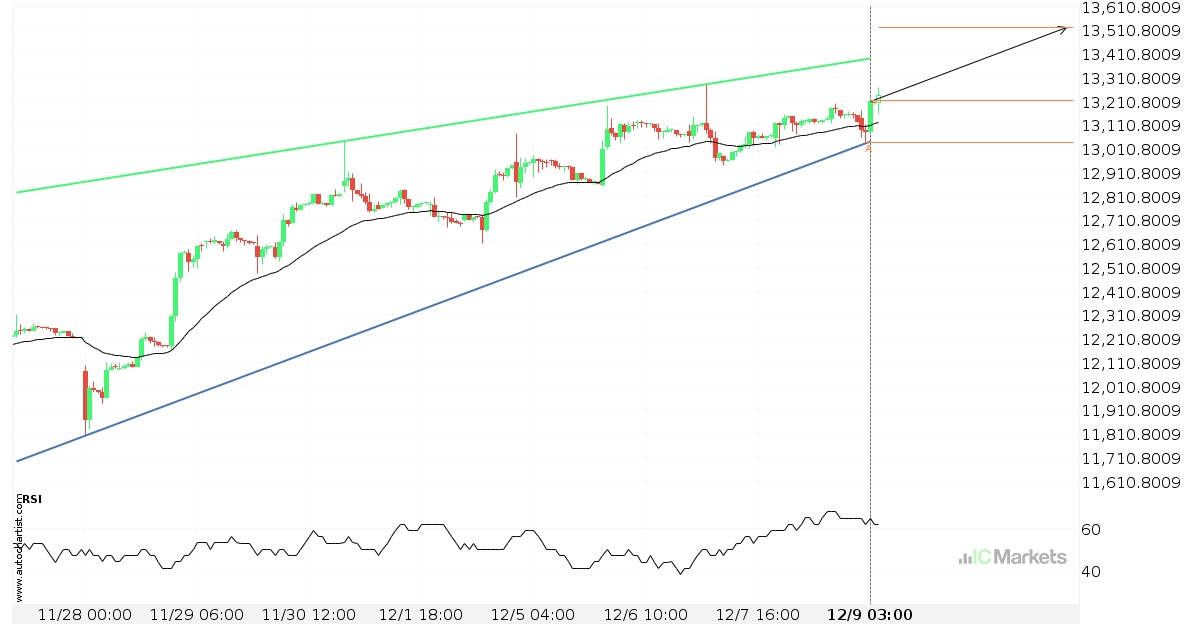
FTSE China A50 Index approaching resistance of a Rising Wedge
FTSE China A50 Index is approaching the resistance line of a Rising Wedge. It has touched this line numerous times in the last 14 days. If it tests this line again, it should do so in the next 3 days.
FTSE China A50 Index approaching resistance of a Rising Wedge
FTSE China A50 Index is approaching the resistance line of a Rising Wedge. It has touched this line numerous times in the last 11 days. If it tests this line again, it should do so in the next 2 days.
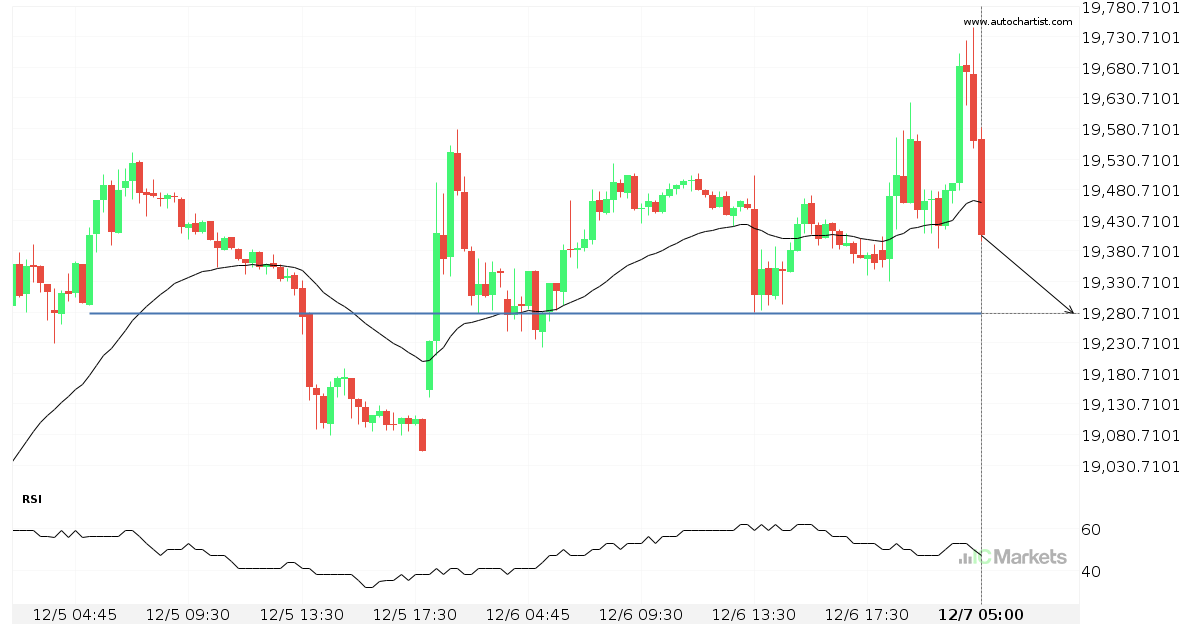
Hong Kong 50 Index – getting close to psychological price line
Hong Kong 50 Index is moving towards a support line. Because we have seen it retrace from this level in the past, we could see either a break through this line, or a rebound back to current levels. It has touched this line numerous times in the last 2 days and may test it again […]
FTSE China A50 Index experienced an exceptionally large movement
For those of you that don’t believe in trends, this may be an opportunity to take advantage of an exceptional 7.35% move on FTSE China A50 Index. The movement has happened over the last 10 days. For those trend followers among you, you may think about riding this possible trend.
Hong Kong 50 Index – getting close to resistance of a Rising Wedge
Hong Kong 50 Index is moving towards a resistance line. Because we have seen it retrace from this line before, we could see either a break through this line, or a rebound back to current levels. It has touched this line numerous times in the last 9 days and may test it again within the […]